Former Employee
- Mark as New
- Bookmark
- Subscribe
- Mute
- Subscribe to RSS Feed
- Permalink
- Report Inappropriate Content
Tracing and capturing Qlik Sense Enterprise on Windows traffic using Fiddler HTTP Debugging Proxy
Last Update:
Apr 28, 2023 5:33:58 AM
Updated By:
Created date:
Sep 15, 2017 9:21:23 PM
This article describes how to trace/capture Qlik Sense Enterprise on Windows traffic using Fiddler.
What is Fiddler?
- HTTP Debugging Proxy
- Logs all HTTP traffic between your computer and any web server
- Freeware – can be downloaded from https://www.telerik.com/download/fiddler
How does it work?
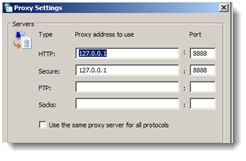
- Fiddler changes the proxy settings (Internet Properties – Connections – LAN settings – Advanced) for the currently logged on user for HTTP traffic when running
- All HTTP traffic will go through Fiddler on port 8888, i.e. Fiddler will listen on this port
For HTTPS:
- Download and install Fiddler on the client, from https://www.telerik.com/download/fiddler
- Launch Fiddler (It will start the capture automatically)
- Stop the capture (File > uncheck "Capture traffic") and clear the sessions (Right-click > Remove > All sessions)
- Follow the steps at the following link to decrypt HTTPS traffic: https://docs.telerik.com/fiddler/Configure-Fiddler/Tasks/DecryptHTTPS
- Start capture again (File > check "Capture traffic")
- Navigate to the URL to be traced, for example https://qvserver/hub
- Go to File > Save > All Sessions. Save the file(file type .saz)
For HTTP:
Qlik Sense Server Setup
- Log in Qlik Management Console (QMC) of Qlik Sense
- Go to Start > Proxies
- Double click the node you are using
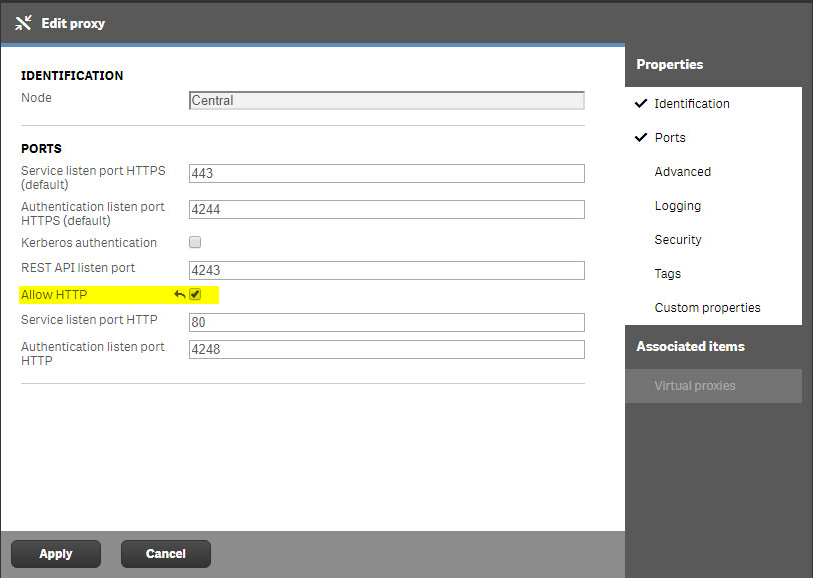
- Tick "Ports" in Properties menu. Tick "Allow Http" and Press Apply button
- "Proxy restart required" window pop up, press "OK" button
- Go to Windows services.msc and restart Qlik Sense Proxy Service
How to use Fiddler
- Download and install Fiddler on the client, from https://www.telerik.com/download/fiddler
- Launch Fiddler
- Navigate to the URL to be traced, for example http://qvserver/hub. Note: URL has to be HTTP
- Tracing will start immediately. To stop capturing traffic go to File > Capture traffic or press F12
- Go to File > Save > All Sessions. Save the file(file type .saz)
Related Content
Tracing and capturing QlikView traffic using Fiddler HTTP Debugging Proxy
How to get a network trace from Fiddler to troubleshoot Qlik Products
Environment
3,903 Views


