Unlock a world of possibilities! Login now and discover the exclusive benefits awaiting you.
- Qlik Community
- :
- Support
- :
- Support
- :
- Knowledge
- :
- Support Articles
- :
- How to set up Performance Logging for Qlik NPrinti...
Options
- Subscribe to RSS Feed
- Mark as New
- Mark as Read
- Bookmark
- Subscribe
- Printer Friendly Page
- Report Inappropriate Content
How to set up Performance Logging for Qlik NPrinting
No ratings
Turn on suggestions
Auto-suggest helps you quickly narrow down your search results by suggesting possible matches as you type.
Showing results for
Digital Support
- Mark as New
- Bookmark
- Subscribe
- Mute
- Subscribe to RSS Feed
- Permalink
- Report Inappropriate Content
How to set up Performance Logging for Qlik NPrinting
As a troubleshooting step in analyzing NPrinting Server crashes or Performance-related issues, it can be useful to use Microsoft Performance Monitor to record the resource utilization by NPrinting as it relates to overall resources on the server. The resulting log file can then be analyzed using QlikView or Qlik Sense for example.
Environment:
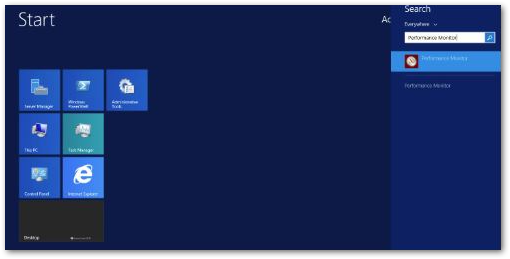
- Start Performance Monitor on the server you want to monitor.
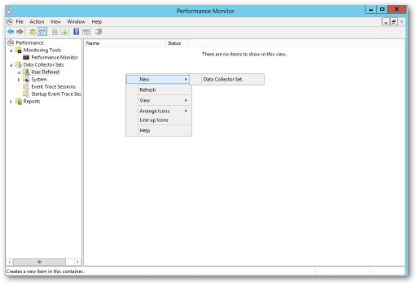
- Navigate to "User defined" and right-click, select New- Data Collector Set
- Give the new Collector Set a meaningful name and select "Create manually (advanced)"
- In the next step we want to "Create data logs"and select "Performance Counter" as the source and then press "next"
- Then press "Add" to start selecting the Performance counters we are interested in recording.
- The first one we want to select is called "% Processor time" and we want it for instance "Total"
- Next we want to select "Available MBytes" under Memory to get the total free memory on the machine
- Next we want to select the information about the NPrinting Server process we are interested in. We want to capture "% Processor Time" and "Working Set - Private" for the Instances called Qlik.Nprinting.Engine, Qlik.Nprinting.Scheduler, Qlik.Nprinting.webEngine Then press "Ok"
- Also capture reporting_web_renderer.exe if you are experiencing image rendering issues
- Then check that you got the counters as shown in this picture, and that you have set the logging interval to log every 5 seconds. Press "next"
- Then set the directory where you want the log to be saved and press "next"
- Then select "Save and close" and press "Finish"
- Next Right-click your newly created data collector set and press "properties"
- In the dialogue, change "Log format" to "Comma separated"
- On the "File" tab, give the file a descriptive name, Node ID might be a good idea if you have more than one server you are logging And press "OK"
- Finally, right-click the Data collector and clisk "Start"
- Then leave the Data Collector running until you have captured the data you want.
Qlik NPrinting

Qlik NPrinting
466 Views

