Unlock a world of possibilities! Login now and discover the exclusive benefits awaiting you.
- Qlik Community
- :
- Support
- :
- Support
- :
- Knowledge
- :
- Support Articles
- :
- Useful Wireshark features and tests for communicat...
- Subscribe to RSS Feed
- Mark as New
- Mark as Read
- Bookmark
- Subscribe
- Printer Friendly Page
- Report Inappropriate Content
Useful Wireshark features and tests for communication troubleshooting
- Mark as New
- Bookmark
- Subscribe
- Mute
- Subscribe to RSS Feed
- Permalink
- Report Inappropriate Content
Useful Wireshark features and tests for communication troubleshooting
Dec 2, 2022 8:20:57 AM
Jun 30, 2015 10:34:05 AM
This article explains a few basic tests and features that can be useful for troubleshooting communication issues. It is written with the intention that the reader wants to know more about how to use WireShark for troubleshooting network and QlikView related issues.
WireShark is a network analysis tool, much like Fiddler. While Fiddler intercepts traffic on level 7 of the OSI-model, the Application layer where HTTP is operating, WireShark can go all the way down to level 2 - Data Link, meaning it is able to analyze network traffic on a packet level. This naturally gives a lot of information as a packet holds usually somewhere between 50 and 1500 bytes.
This article assumes the reader has some basic knowledge of TCP/IP and the OSI-model, and network interface cards (NIC). Please see Wikipedia for more information.
Starting a basic trace:
The most basic way of starting a trace, is to select which network interface to start capturing from, and press Start. After you believe the issue has been reproduced and/or captured, press the red Stop button and save the trace, which you can find under File > Save file as. Usually the pcapng (newer) or the pcap (legacy) format does the trick.
If the network interface you have chosen does not appear to capture the traffic, it might not be prioritized.
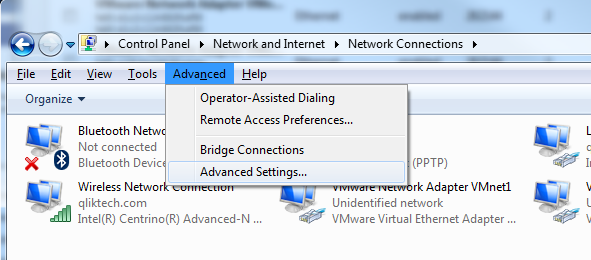
One way to solve this is to disable the NICs not being used under Control Panel\Network and Internet\Network Connections.
The other way is to prioritize the NIC you want to use, by going into Control Panel\Network and Internet\Network Connections > Advanced > Advanced Settings:
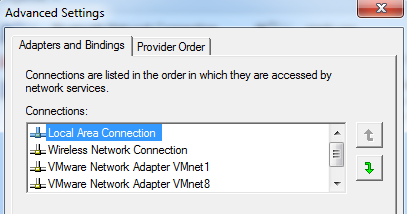
Arrange the Connections list to let the network interface card you are to capture traffic with, be in the top, like this:
This will ensure traffic flows by priority through our intended NIC.
Only capturing traffic based on port 4747, enabling filters:
As you might know, QlikViewServer listens on port 4747 which the the other QlikView services, IE plugin and QlikView Desktop connects to. In WireShark there is a feature called "filters", which you can use to specify exactly which packets you want to have available for analysis. A filter is thus an expression where you define the criteria for what you want to capture. There are two types of filters, capture filters (which only captures traffic based on a critera) and display filters (which captures all traffic but only shows certain traffic). We will show both here and how to apply them. In most customer scenarios though, it is very useful to capture all traffic and filter on display only, enabling the analyst to see other traffic as well. Thus it doesn't omit any traffic, and if you need to go back to the original traffic it is still there despite applying a filter. On the other hand, it is using more resources as it is capturing everything.
Capture filters:
Before starting a capture, press Capture > Interfaces > Options. Under the button "Capture Filter" you'll find a few samples. In our case we define a host (not restricting to source (client) or destination (server)), and a port, by writing:
port 4747 && host 172.16.16.100
It should look something like this:
Display filters:
Display filters work in a similar way as capture filters, the main difference is that it is applied afterwards instead, and still captures all traffic. You can find these under "Filter" in the main window, and if you hit "Expression" you can find several useful filters.
In our example, we'll apply the same type of traffic filter, which now looks a bit different:
tcp.port == 4747 && ip.addr == 172.16.16.100
Finding time-outs in traffic / Changing time-viewing settings:
In scenarios where you believe there is a slow connection at fault, it might be useful to change the time format of the capture. These can be found under View > Time Display Format. The columns can then be arranged by the time-format, by clicking on the Time column. A few useful view-settings are:
Date and Time of Day - standard format of viewing time.
Seconds Since beginning of Capture - shows you how much time has elapsed since you started capturing traffic
Seconds since Previous Captured Packet - shows you how much time has elapsed since the previous captured packet. Would be useful in case of measuring time-outs.
Resolving computer names connected to a server:
When capturing a lot of traffic flowing through the network, a seemingly endless supply of IP-addresses and MAC-addresses are captured. In order to easier understand who talks to who, these names can be resolved in order to get immediate access to which server has which IP-address. This can be done after the trace, in order to not "spam" additionally traffic. There are three types of name resolution in WireShark, MAC name resolution (MAC address to IP address using ARP), Network name resolution (IP address to DNS name) and Transport name resolution (Port number to protocol, e.g. displaying 80 as http). You need access to a DNS server or a repository, e.g. a router in this case. These settings can be found under View > Name Resolution > Enable for x Layer, in WireShark.
Before applying all three filters (notice that source MAC and destination MAC columns are added here too):
After applying all three filters:
Which computers connects most to this server?
If you are suspecting you have one client using all the bandwidth, or spamming the server, it could be useful to capture some of the traffic and analyze the connections between the servers and/or to the server itself. Running WireShark on a server would not only capture information on what client is connecting to the server, but also allows you to count how much traffic is being sent and received with each of the clients. To view this information after you have captured some traffic, you can use a few different options.
Statistics > Endpoints
Shows you which clients sends the most traffic towards the server. Check the IPv4 tab and arrange by packets or bytes in order to be useful.
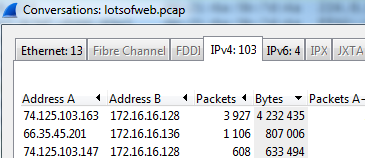
Statistics > Conversations.
Shows you which two computers talk most to each other. This would tell the analyst if there is a lot of traffic flowing between two clients that utilized a lot of bandwidth from the rest of the network, meaning possibly not going directly to the QlikView Server, but using up resources nonetheless.
Is the communication even established between a server and IE plugin?
All TCP based communication must begin with a handshake between two hosts. QVP protocol uses this handshake procedure too. This allows the two devices to know that the other host is up and able to communicate, that the port is open and that the other host is ready to receive data. Once this process is complete, both devices have all the necessary information they need to begin communication. This means, if for instance IE plugin does not receive back a SYN, ACK from the server, it has not acquired all the correct information from the server to begin communication. This might be the case when a device is distorting the traffic in between, like a proxy, a VPN or a firewall. It is useful to check this as a start, when there is communication issues.
This process contains no data, and can be seen in the packet capture as:
<source host > to <destination host (e.g. server)> SYN
<destination host> to <source host> SYN, ACK
<source host> to <destination host> ACK
Is the connection refused by the remote device as no service is listening?
In TCP traffic, the RST flag is used to indicate a connection was closed abruptly or to refuse a connection attempt. When the client tries to connect on a port that there is nothing listening at, for instance a custom port for QlikView AccessPoint defined as 8080 (but for some reason it is misconfigured), the server will respond to the attempted communication with a RST packet, telling the client that communicate won't be possible on this port. The communication from the server should include RST and ACK flags, and no further communication follows. Notice in the screenshot how the communication happens immediately as well.
Is the remote device exhausted from resources? Or is it just slowing down?
WireShark captures the flow of data between two endpoints. If you can see that the TCP transmission seems to work, by the continued ACK statement of the receiver, traffic is going well. If there is no ACK received anymore (acknowledge of transmission), the sender tries to send a retransmission packet, TCP Retransmission. TCP Retransmission is a very vital part of TCP, which is design to combat packet loss. If a retransmission threshold is reached, the sending device assumes that the remote device did not receive the data, and it retransmits the packet again. This process is repeated a few times before communication effectively stops.
In this scenario we can see that the time since last sent packet has taken a few seconds (see above on how to change time settings), and increases for each packet. This would indicate that the other endpoints resources are either completely saturated, or that there is some kind of interruption in the line. Usually though, if the router sending the traffic does not have a connection at all, we would get back a response saying that there is no endpoint on that address. We also would not have traffic flowing before the time-outs and then suddenly stop.
On the other hand, if the retransmissions would slowly increase in time already in the beginning of a connection, it could indicate just that there is a slow connection. If there are retransmission packets before the traffic start to flow, it is possibly too slow for a reliable connection to be established. The way it works is because the destination host has issues receiving traffic, the source slows down the traffic being sent, slower and slower until it is possible to reach the end-point (by receiving back an ACK packet). Once this time-out has been established, it will be used as a guideline for communication, in order not to overflow the destination host.
What if the destination host is fast and the source host is fast - could there be a slow connection?
An easy way to confirm this is by looking at the establishment of communication. The communication between two units require a SYN from the source, a SYN, ACK from the destination and another ACK from the source. After this first establishment, the rest of the communication will continue. In the above examples it was already established, or had issues even establishing communication. A SYN and ACK packet requires very little resources, so should be very fast to transfer. In most scenarios this takes slower than 0.1 seconds. If you believe that the connection itself is slow due to a bad latency (e.g. "Ping"), a good indication can be the slow return of the SYN, ACK packet from the destination.
Here is an example, notice how packet 2 and 5 from the destination took a long time to return, almost a second:
This would indicate a slow router, a firewall, a proxy or something else that slows down traffic. A good test would be to get "closer" to the destination and check if the connection is faster.
Is all the traffic reaching the endpoint? Could it be distorted?
A common discussion between developers and system administrators is whether the code in an application corrupts data or if the network malforms it during transport. WireShark has a built-in tool to review the data being sent, if is sent in clear-text, like .csv, .txt and similar files. In this scenario it is important to gather the data at the very point where it is sent to, in order to verify it properly. Once the traffic has been collecting for analysis, we can right click and press "Follow TCP Stream". This will read the actual data being sent, which means if you read e.g. FTP traffic, it will look like this:
This connection information perhaps not very useful, as this is the very logs we can see in the FTP client. However during the actual transfer, the protocol FTP-DATA is listed in WireShark, which can show us the content of e.g. an CSV file.
Here we start the trace at the first FTP-DATA packet visible in WireShark:
Here we can clearly see the content of a .csv file, meaning the transfer seems to go well. If there is an error with data, it might be in the actual software sending it. This can be useful when there are discrepancies regarding the file-transfer.
Reading SSL data with WireShark.
If you have troubles reading SSL traffic in WireShark, please see the following resources:
- TLS - WireShark.org
- How to Export and Use SSL Session Keys to Decrypt SSL Traces Without Sharing the SSL Private Key
- Decrypt saved capture with private key - Ask.WireShark.org
Related Content:
How to use Wireshark to capture local loopback traffic for analysis for Qlik software


